Screen Shots
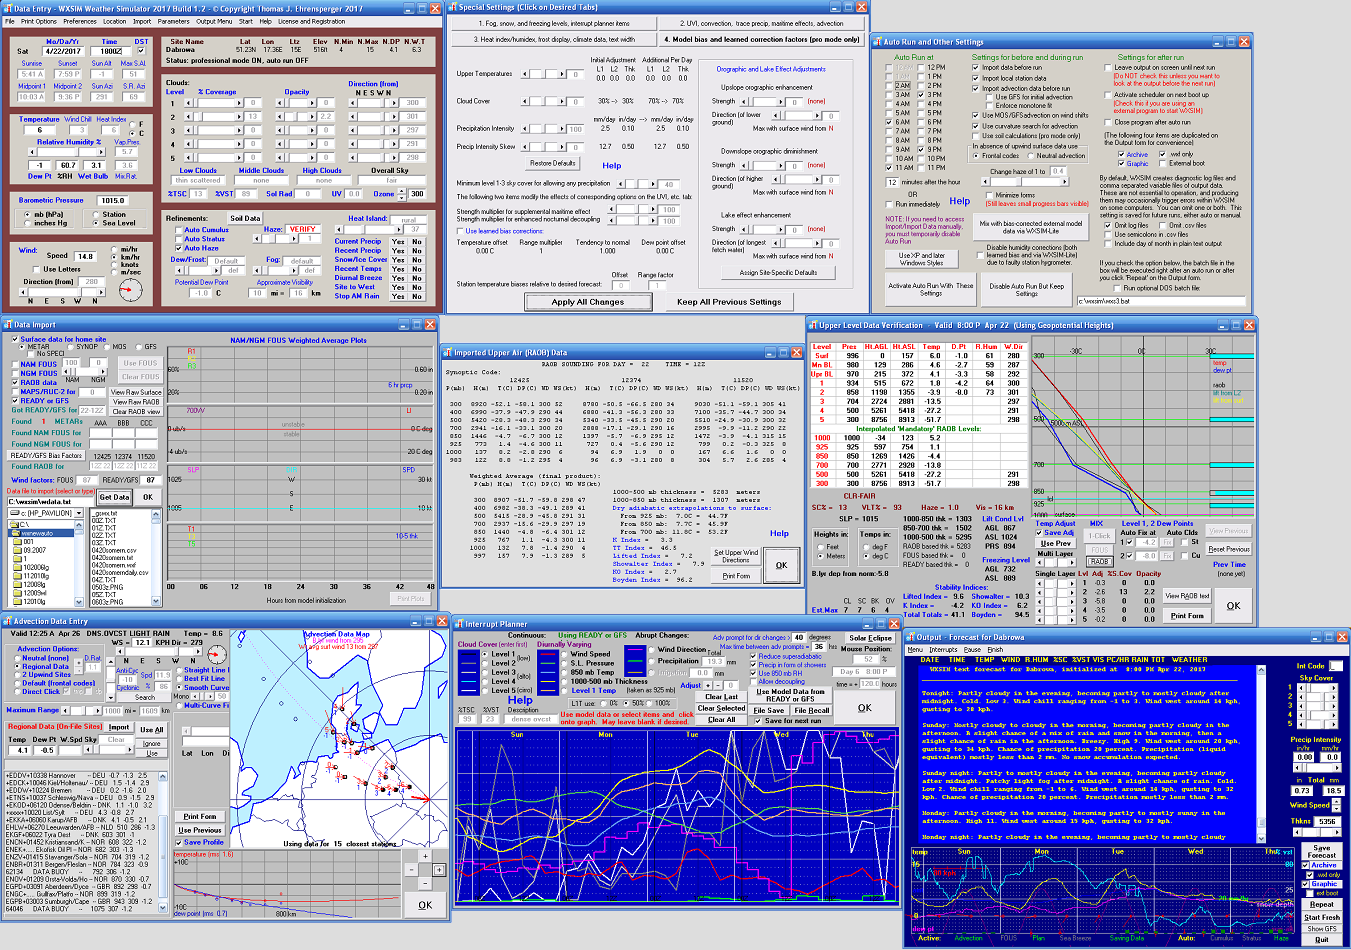
WXSIM has a huge array of options and abilities. A challenge in describing is to give a full picture of what it can do (for advanced users or those who really want to explore) without 'scaring off' beginners or those who simply want a simple, convenient, locally specific forecast WXSIM meets the needs of both ends of such a spectrum. The following images (from over 70 possible forms one could see with full-blown use of the system) should provide a better idea of what WXSIM is and does. You would not necessarily interact with - or even see - all of these during typical use, since streamlined, automated operation is the norm for most users. The collage of shots below are from a forecast I ran manually (most people use auto run mode and see little of this) for Dabrowa, Poland.
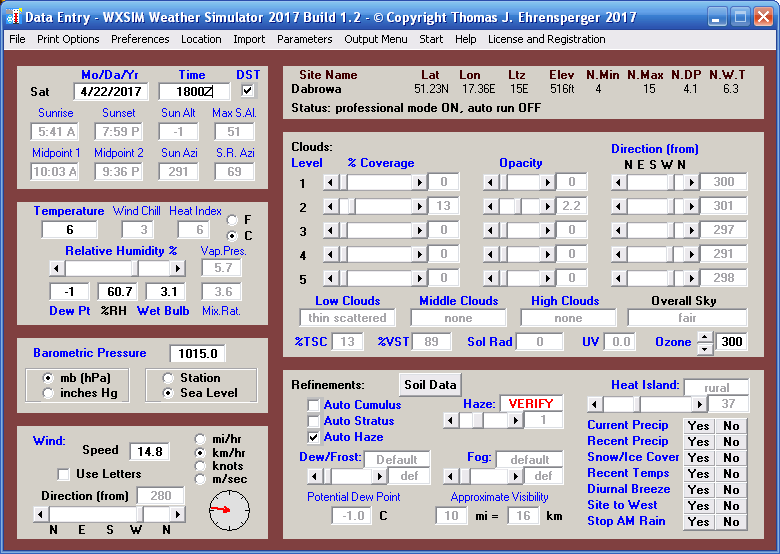
Here are close-ups of these and more, with explanations and commentary. The first screen you would see, or interact with, is the Data Entry form. Almost everything here is manually controllable, but is usually filled out automatically by importing data - from the internet, your home weather station, or both.
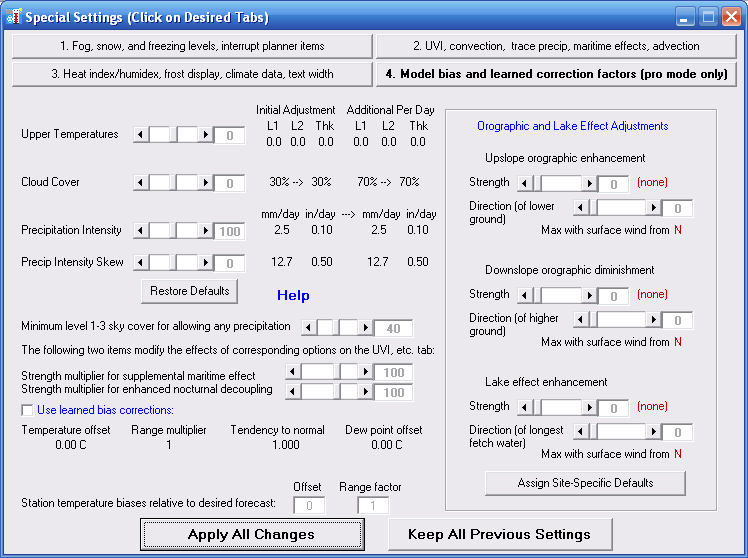
Under Preferences, there are lots of settings you can make to fine-tune the forecast accuracy and content. Most users rarely touch these controls (as I make appropriate settings during customization), but here is an example, again, shown for the purpose of illustrating the depth of what WXSIM does.
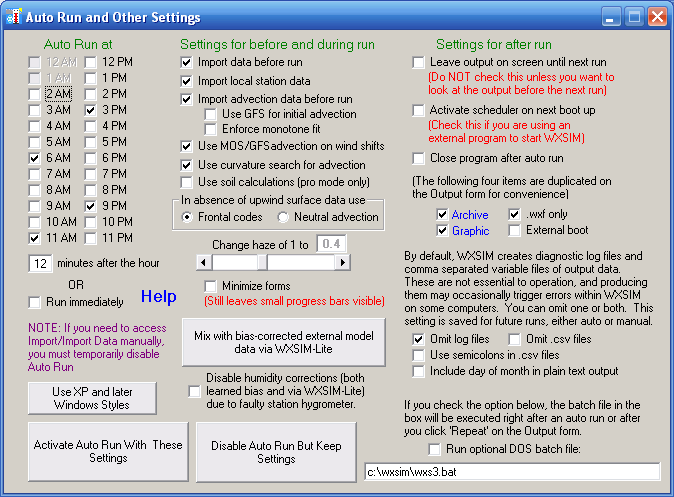
Here is a form users do often visit, in order to set up a forecast schedule and various other options.
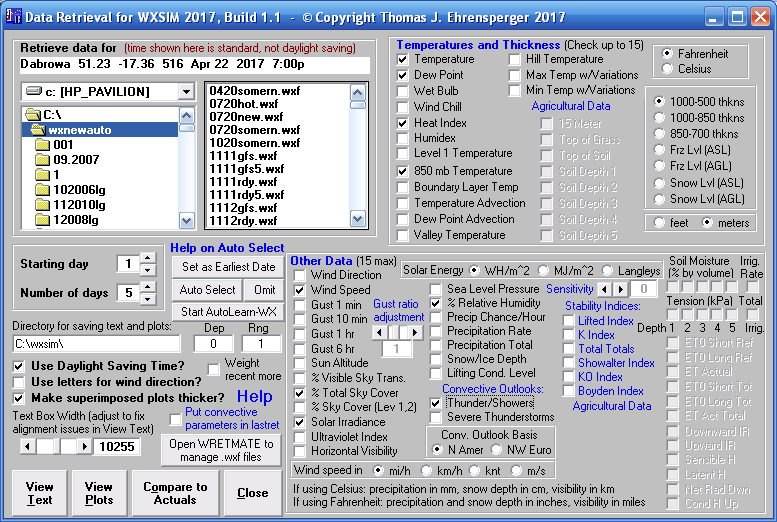
WXSIM imports a variety of surface, upper air, and model data from internet sources. First, the auxilliary program WXSIMATE collects the data and collates it into a file for the main WXSIM program, which then reads that file.
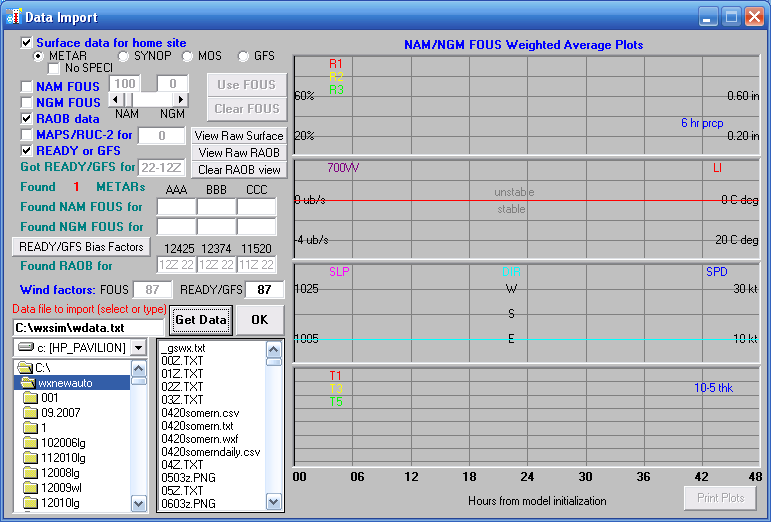
Among the information types WXSIM ingests is upper air (RAOB, or radiosonde) data, from balloon launches. In customization, I assign your location three surrounding upper air sites, from which WXSIM interpolates conditions specific to your location.
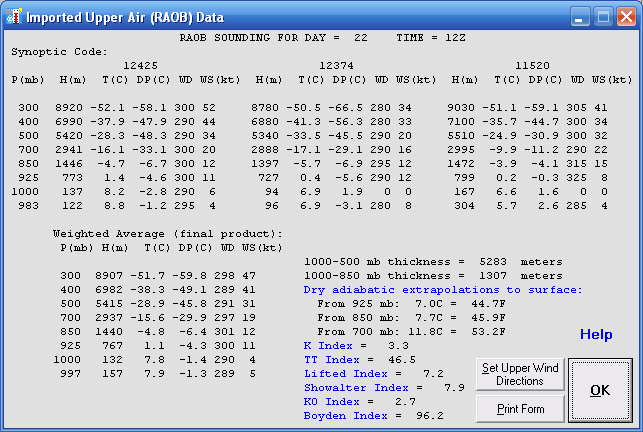
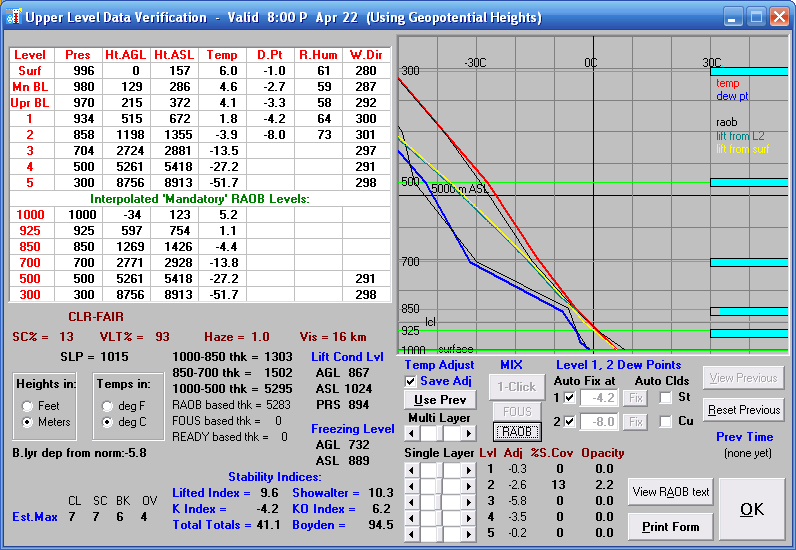
Imported upper air data optionally overrides default data based on surface data and climatology. Here, as throughout the program, WXSIM stands ready with very good 'educated guess' values in case internet-based data is ever missing. This is a consequence of WXSIM history, long pre-dating access to online sources.
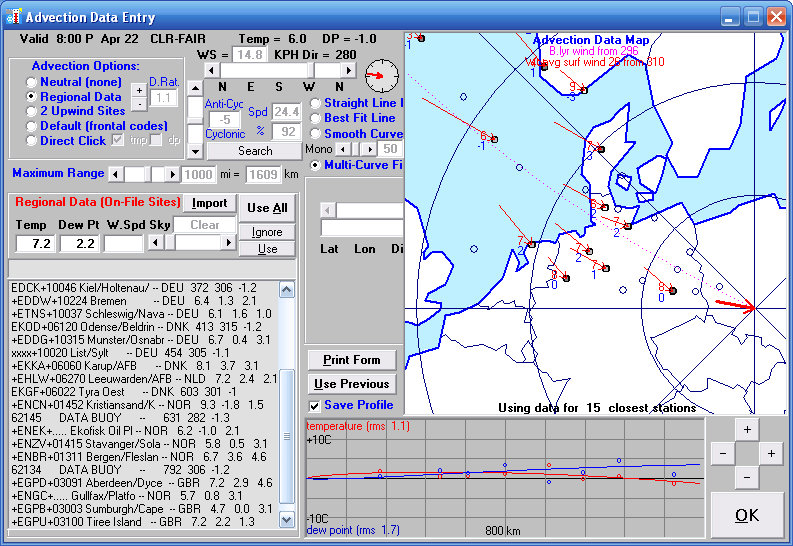
A vital aspect of WXSIM's forecast process is the use of advection data - that is, temperature and dew point information from a number of locations upwind of the forecast site. Typically, I assign over 200 such surface sites, in all directions, out to over 1000 miles (1600 km) distant. Data from these is adjusted based on elevation, cloud cover, wind speed, and intervening topography to get accurate conditions for air masses advecting into the region.
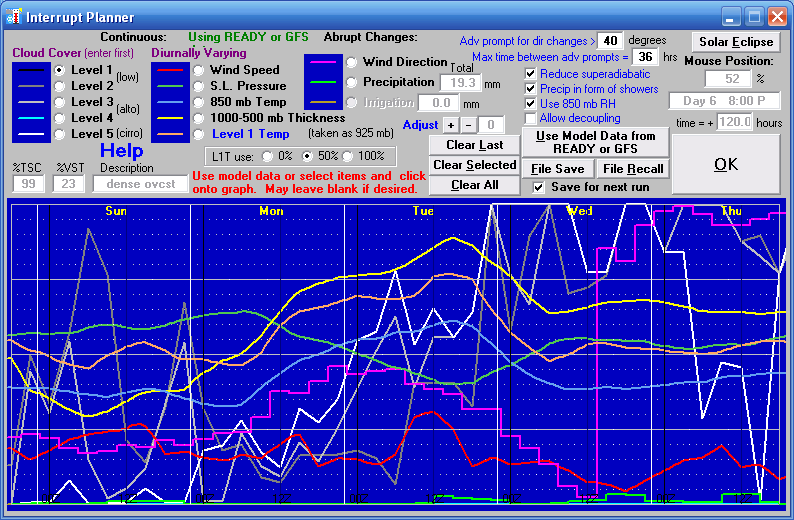
The Interrupt Planner is where WXSIM displays external model data (usually from NOAA's GFS model, which has global coverage out to 10 days for use with WXSIM), subject to optional manual adjustment by the user. Only a few users, including at least one professional forecaster, actually take advantage of this option regularly, but it's yet another example of WXSIM's great flexibility.
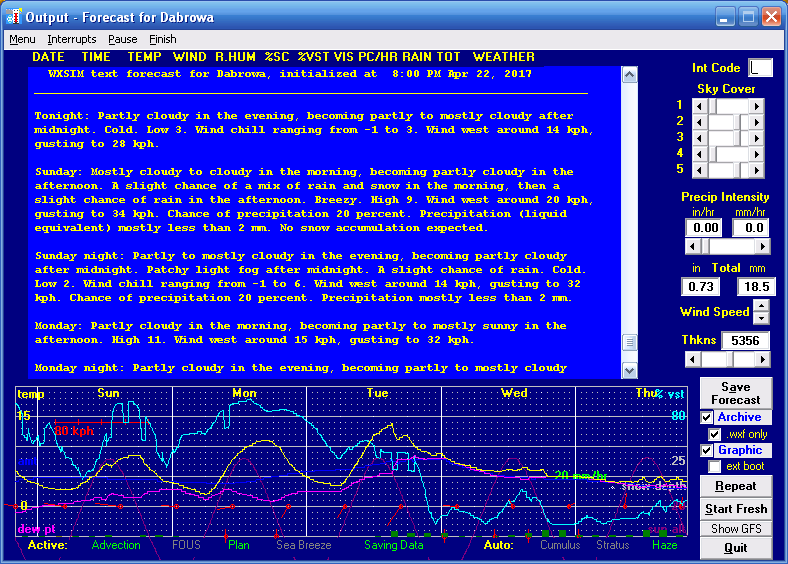
The resulting forecast is displayed as both scrollable text and graphics. Half-hourly details are out of sight above the visible window in this view, but can be scrolled to. Also, the forecast details are saved in a variety of formats, including text, spreadsheet-readable .csv, and a proprietary format just for use with WXSIM's data retrieval program.
The companion data retrieval program wret.exe offers a huge array of options for both text and graphical display of data from forecasts already made by WXSIM.
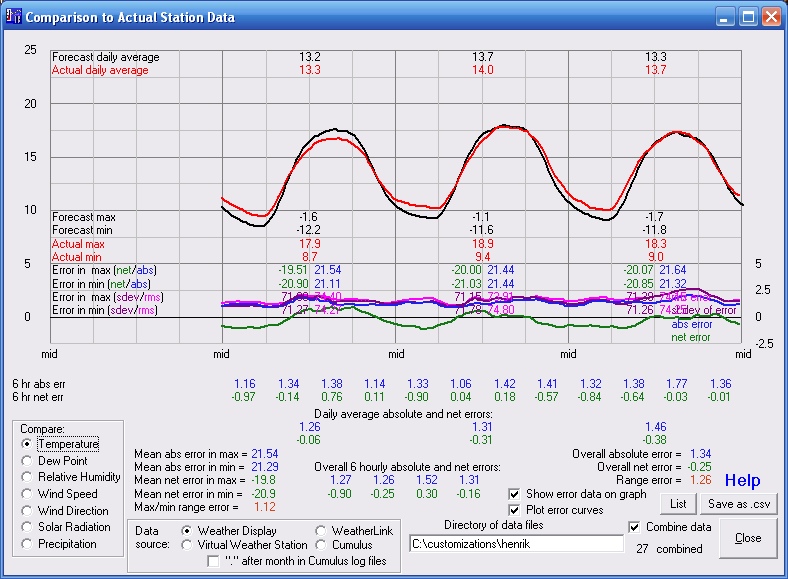
In addition to forecast plots (like the screen shot in the carousel display on the main page), wret.exe allows comparisons for forecast results to actual data. This can be used for sophisticated 'learning' (almost like artificial intelligence) to improve future forecasts automatically, but it can also be a general tool (mainly for me!)for diagnosing forecast errors in order to improve the program and customizations. Here is a real example, where a user in Denmark was reporting some forecast inaccuracies, and I was analyzing his data (27 forecasts, spanning a couple of months) in order to diagnose the problem and make improvements. Forecast temperatures here are averaging about right, but the forecast diurnal range (max minus min) is a bit too big.
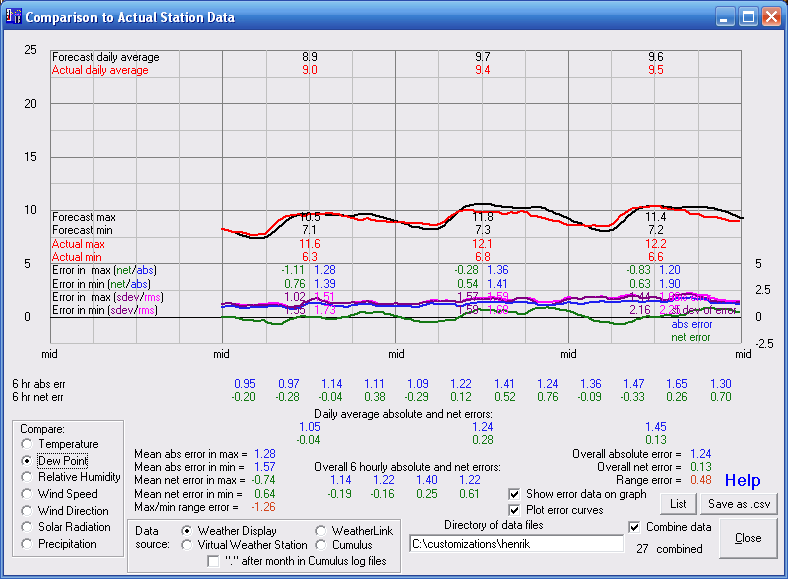
Forecast dew points, however, were almost perfect! Note the complex curve, where dew formation overnight slightly reduces the amount of airborne moisture, only to have it return in the morning as the dew evaporates, but then dip slightly in the afternoon as daytime heating creates mixing, which brings drier air from higher up down to the surface. WXSIM models these detailed processes, and many others, rather accurately.
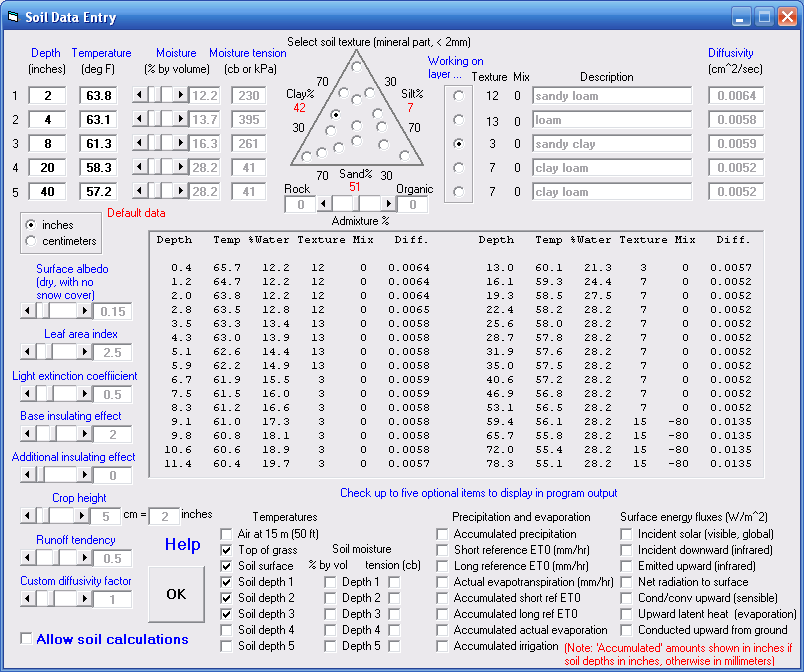
There is still more to WXSIM, but I'll close with an example of a specialized application: agriculture. A few years ago, I dedicated months of research and work to developing a soil temperature and moisture model for WXSIM. This is present in the program, but - like a few other features - its use is limited to the professional mode of operation (an extra $50). I collected a lot of soil data from online agricultural sites, plus a lot of my own soil measurements and experiments and developed a heat and moisture transfer model which is remarkably accurate - especially for temperature (moisture is really tricky, but I've still got it modeled fairly well). The form below is for initial setup of soil parameters.